Section 5 - What is a What-If analysis?
There are three main types of process for conducting a What-if Analysis that we will show on this page, they are:
Direct Experimentation - Changing specific cells manually
The easiest way of seeing how changes to certain values in your spreadsheet can affect the outcome; or "bottom line", is by manually changing the values in question. You can go to a cell and enter different values to see how it will affect the final results and simply undo any changes once you have reached your goal. This is a very useful feature in a spreadsheet that utilises formulas and calculations to produce information.
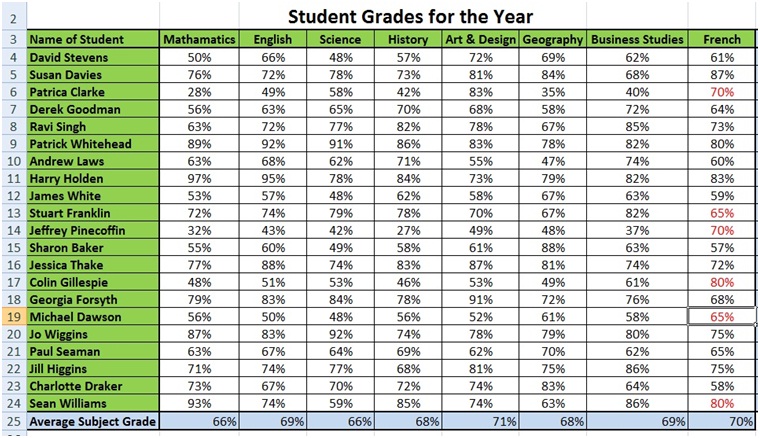
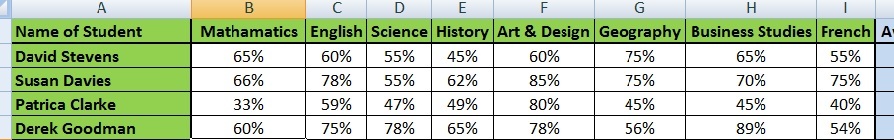
Take the Student Grades for example; if we wanted to see how we could make an average subject mark increase overall we could simply change the values in the student's percentage mark cells. This can be a very useful thing to do although you must be aware that there is some risk associated with this.
Changing cells directly is not recommended for average users as they may not know how to undo the changes; in some cases direct changes to cells can overwrite formula that may have been used to perform important calculations. For this reason it is wise at first to save another copy of your database original, just in case.
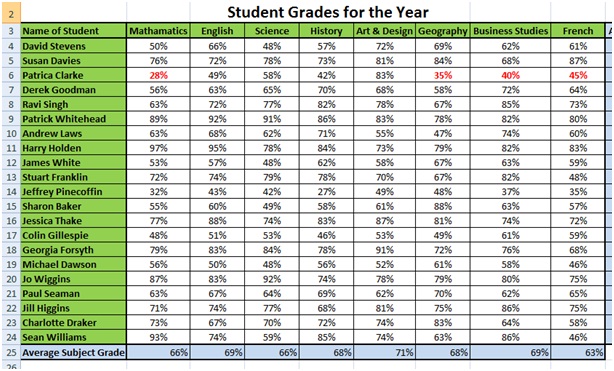
Below you can see how I have physically changed the values in French subject column to raise the "French average to 70%". See values in red:
Return to top of page
Creating scenarios in a spreadsheet
Most modern spreadsheets provide users with a tool named "Scenario Manager". This is a very useful tool that allows a user to create and save alternate scenarios of their spreadsheet for future reference.
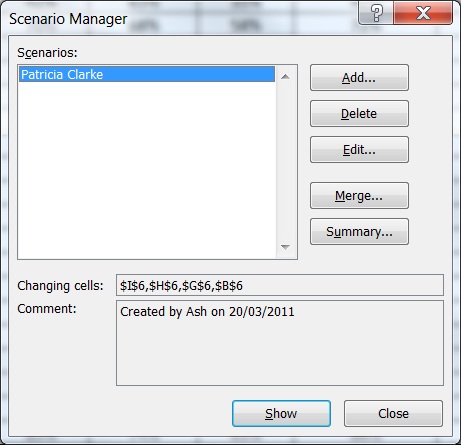
The scenario manager function can be found under the "Data" tab > "What-if Analysis" in Excel 2007; in older versions the Scenario manager may be found under tools. Clicking in the Scenario Manager will produce a window similar to this:
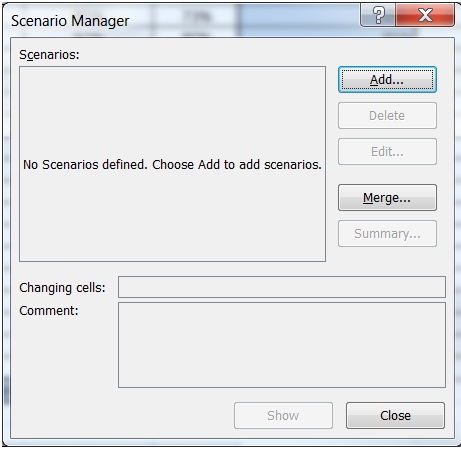
If you click on add a scenario you will see the following window:
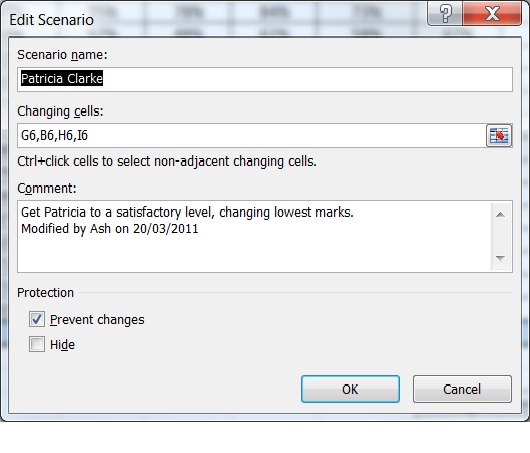
Here you can specify some criteria to base the Scenario on, these criteria will be changes to values in the selected cells. For this example I have chosen to see if I can raise a student's overall pass grade by changing their pass marks in the lowest subjects that they achieved. I have chosen to change her Maths grade, Geography grade, Business Studies grade and French grade.
Once you have named your Scenario and added the cells you wish to change you are directed to this window:
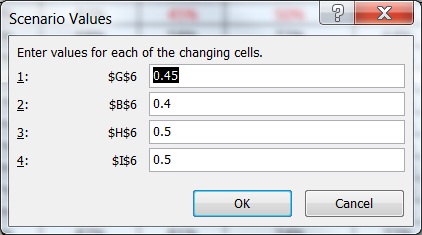
Here you are able to assign specific values to the cells that were selected in the previous window; the Maths, Geography, Business Studies and French grades. In this case I have changed the values to what I think would be reasonable if the student had the chance to improve their work. Clicking ok returns you to the Scenario Manager window and saves your scenario as you named it.
You are then able to show the results directly on your spreadsheet by clicking the show button. You are also able to construct a more detailed view of the changes to the data by clicking on the Summary button. Multiple Scenarios can be saved and can be used with added complexity.
Return to top of pageAnalyzing a Model in a spreadsheet
Analyzing a model that you have constructed allows you to pull more information from what you have. If you were to add extra data into the table, or to the results from a table you are able to create more detailed and useful information.
Take the student marks for example; we can produce Patricia's end of year overall average, but it would be useful if we could combine this information with other data to produce a better indication of her ability. To do this we can construct another table on another sheet in the spreadsheet with her marks from the previous year. This would enable us to see how she was performing other both years and would give us a much more accurate average of her grades. See below:
Now that we have this additional data we can use it along with the first sheet to show her overall average pass marks for the two years. We can also use the individual year's average marks to create an average mark for both of the year's marks. See below:
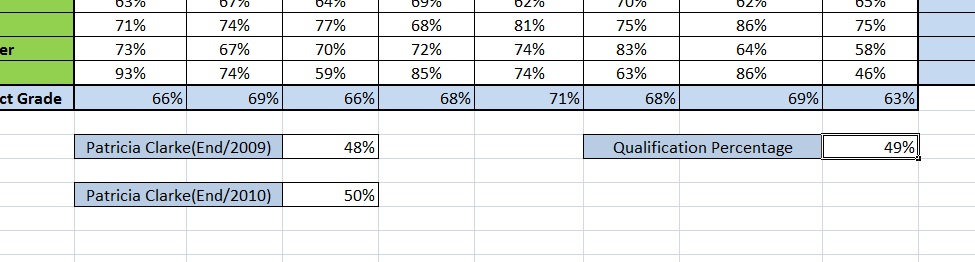
Now we can run the scenario that we saved where we changed her results in the first year to see how the changes will affect the overall average for the two years. When you go into the Scenario Manager to run the Scenario if you click the "Summary" button you will be able to see a summarised table of the changes you have made and how they affect her overall average. See below:
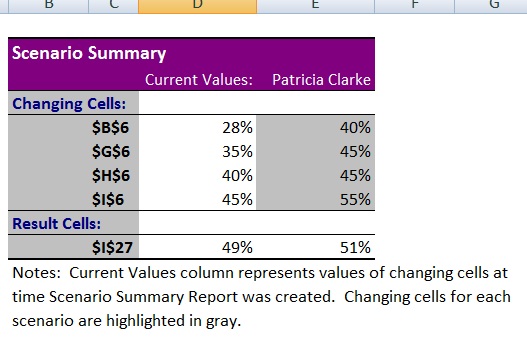
As you can see by changing her marks to the ones on the right of the summary we can increase her overall average to 51%. You could continue this further and add more data into the process to build up a much better picture of the data you have.
Return to top of page